
This episode currently has no reviews.
Submit Review- Podcast |
- Changelog Master Feed
- Publisher |
- Changelog Media
- Media Type |
- audio
- Podknife tags |
- Business,
- Entrepreneurship,
- Interview,
- Master Feeds,
- Software How-To,
- Tech News,
- Technology,
- Web Development
- Categories Via RSS |
- Technology
- Publication Date |
- Feb 07, 2020
- Episode Duration |
- 00:51:30
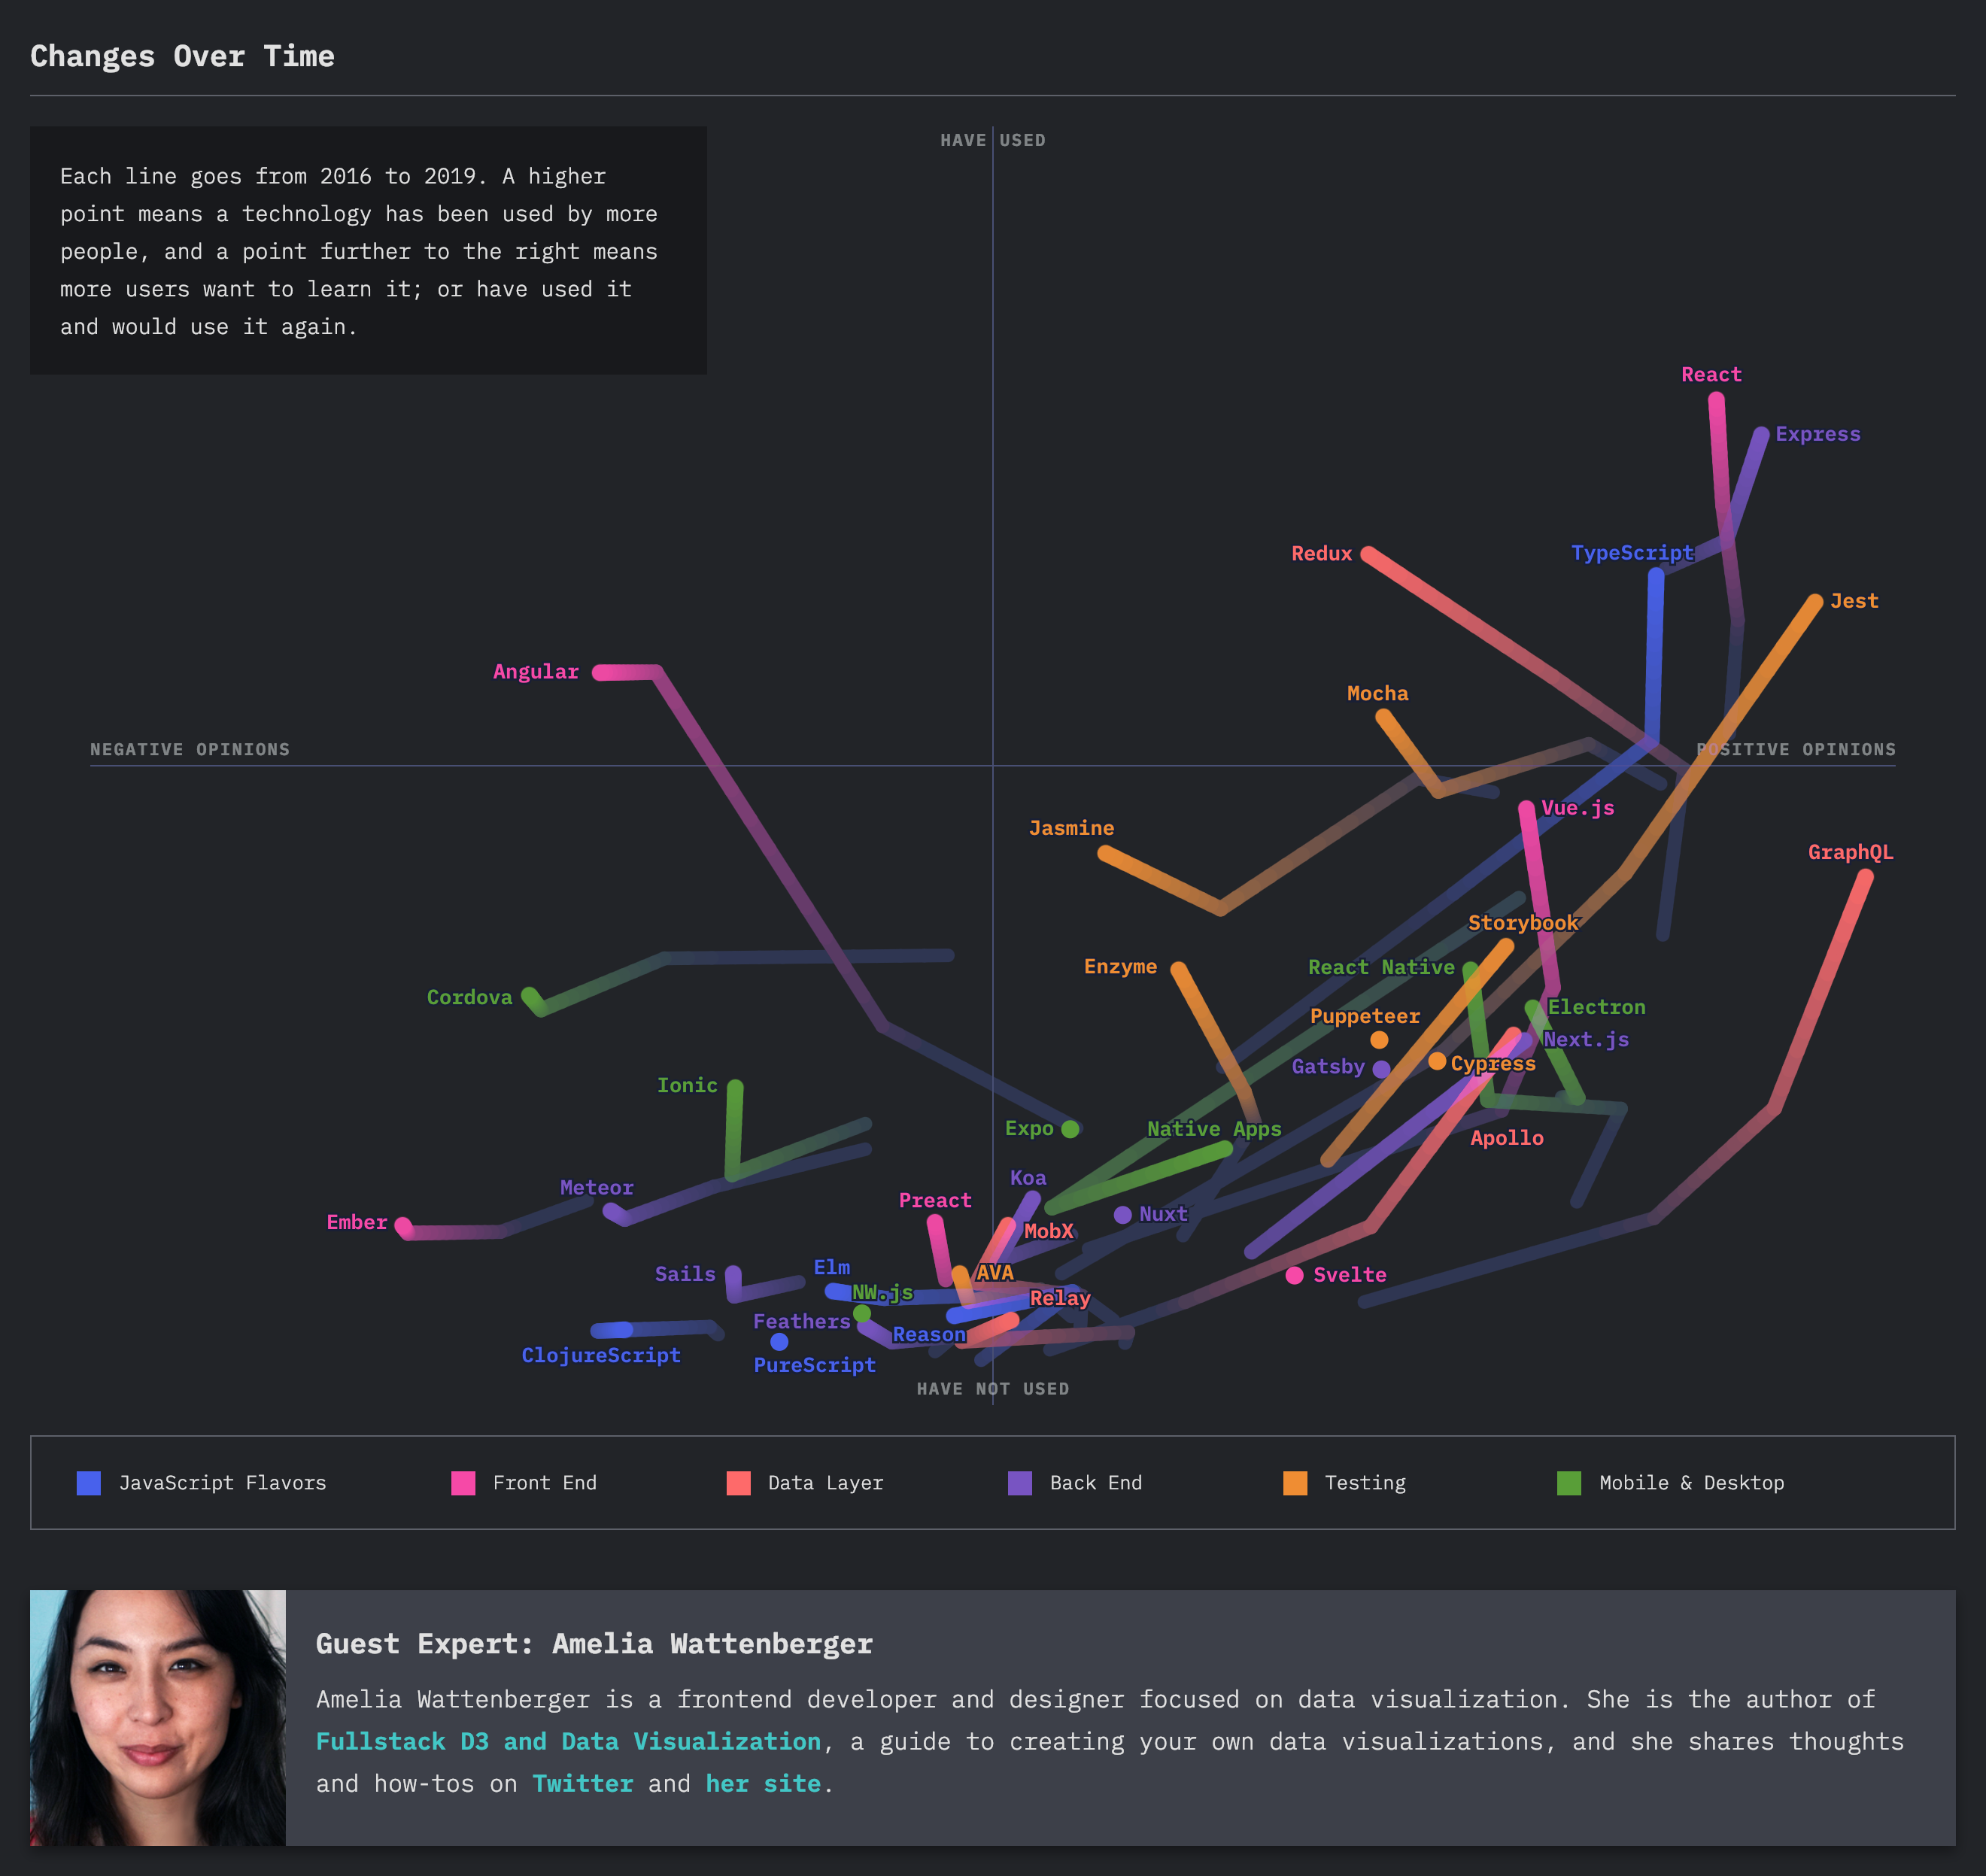
The State of JS 2019 survey left many in awe of the beautifully rendered line graph created by Amelia Wattenberger. So we've brought her on JS Party to discuss how she built it!
We'll chat about all things D3, a JavaScript library for creating data visualizations, and even learn a bit about the CSS cascade.
The State of JS 2019 survey left many in awe of the beautifully rendered line graph created by Amelia Wattenberger. So we’ve brought her on JS Party to discuss how she built it!
We’ll chat about all things D3, a JavaScript library for creating data visualizations, and even learn a bit about the CSS cascade.
Changelog++ members support our work, get closer to the metal, and make the ads disappear. Join today!
Sponsors:
- Rollbar – We move fast and fix things because of Rollbar. Resolve errors in minutes. Deploy with confidence. Learn more at rollbar.com/changelog.
- DigitalOcean – DigitalOcean’s developer cloud makes it simple to launch in the cloud and scale up as you grow. They have an intuitive control panel, predictable pricing, team accounts, worldwide availability with a 99.99% uptime SLA, and 24/7/365 world-class support to back that up. Get your $100 credit at do.co/changelog.
- Algolia – Our search partner. Algolia’s full suite search APIs enable teams to develop unique search and discovery experiences across all platforms and devices. We’re using Algolia to power our site search here at Changelog.com. Get started for free and learn more at algolia.com.
Featuring:
- Amelia Wattenberger – Twitter, GitHub, Website
- Emma Bostian – Twitter, GitHub, LinkedIn
- Jerod Santo – Mastodon, Twitter, GitHub, LinkedIn
Show Notes:
- CSS Cascade by Amelia
- State of JS overview survey
- Star Wars CSS Specificity Wars
- D3 website
- The Fullstack D3 book
- spring.io/">React Spring
- Pudding.cool
Something missing or broken? party-113.md">PRs welcome!
This episode currently has no reviews.
Submit ReviewThis episode could use a review!
This episode could use a review! Have anything to say about it? Share your thoughts using the button below.
Submit Review